
Sweeeet Caroline…..BAH BAH BAH!
I’ve had Boston (Bahston) in my tracker for a little while now, but never seem to have the time to actually look at anything….and I still haven’t! But I had plenty of time to create a forecaster that looks three weeks into the future.
So I’ll just tell you what my formulas are telling me.
Dave, you suck… Thanks formulas......
HISTORICAL DATA (Spark Notes Edition)
Just like everywhere else, Boston had relatively “normal” / “Low” weekly numbers prior to Halloween. Even 4th of July was nothing of serious note. The cases rose by 30% (68 cases) the following week and hit a peak of 543 cases in the week of August 17th. Cases stayed in that general area until the week of October 12th when they jumped to 821 cases. Then 1188 cases the following week. Then the week of Halloween saw 1460 cases and the following weeks saw: 1646, 2115, 2078 and 1966.
The week of 11/9 was 2,115 cases. That’s FOUR TIMES the amount of cases in the second week of October which had 575 cases.
Since then the case count has barely dropped below 2000 a week. (1966 cases the week of 11/23) The biggest spike was the first week of December with 3,180 cases, 193% of the cases the week prior.
Then we get to the week of 12/7, 3,985 cases. Highest yet.
So what do our formulas tell us?
FORMULA FORECASTS
4 Week: 1.29 Spread Rate = 4907 Cases
3 Week: 1.29 Spread Rate = 4911 Cases
2 Week: 1.44 Spread Rate = 5494 Cases
14 Day Average: 580 Avg= 4057.5 Cases
7 Days Average: 655 Avg = 4586 Cases
MY PREDICTION
Admittedly, I’m cheating. This week is already at 1,011 cases in Suffolk County. That’s more cases on in the first two days of the week than any other recent week. With this in mind, the new 7 Day and 14 Day averages are:
7 Day- 666 | 4660 cases
14 Day- 620 | 4341.5 Cases
4300 Cases would be a 3.5% increase from last week. Last week’s increase was 4.6%. So the 14 Day Average Forecast actually looks close to reality. However, all my other formulas are forecasting a bigger increase. And my future model has the week of 12/21 increasing past 6000 or 7000 cases. I highly doubt that will actually be a recorded number seeing all the holidays delaying tests. Most likely the weeks after Christmas and New Year’s will see the brunt of all those missed tests. Especially with all the holiday travel coming up.
I’d say the high case count at the beginning of the week’s means my formulas are probably close to right. However, travel and holidays may delay the actual case recording.
Prediction: 4900 Cases
AFTER NOTES:
Throwing all my Actual and Forecasted Spread rates into a graph, we can see that the Actual Spread Rate is steadily rising.
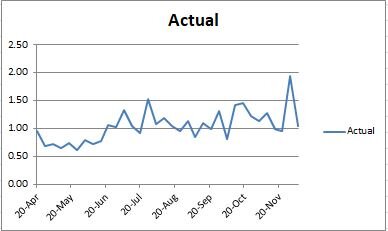
We also see that my weekly forecasts have stayed within the range of actuals. None of them have spiked outside of the “norm.”

And here is a graph where I lined up all the weekly forecasts. So The 4 Week Average is set back 4 weeks. The 3 Week set back 3 weeks and the 2 Week Average is set back 2 weeks.
